Gold vs the S&P 500 in Every Bear Market Since 1971: The Full Dataset
How has gold actually behaved in gold vs stock market bear markets? This dataset records every S&P 500 price-index bear market since gold began trading freely, with gold's return measured over the identical peak-to-trough interval. It is descriptive, not predictive: the episodes where gold fell are documented as plainly as those where it rose. Customers should speak to a financial or tax advisor before making decisions.
Educational only: This dataset is not a ranking, recommendation, or prediction. It records historical figures computed from public primary sources. Customers should speak to a financial or tax advisor before making decisions. Goldco does not offer tax or legal advice. Past performance does not guarantee future results.
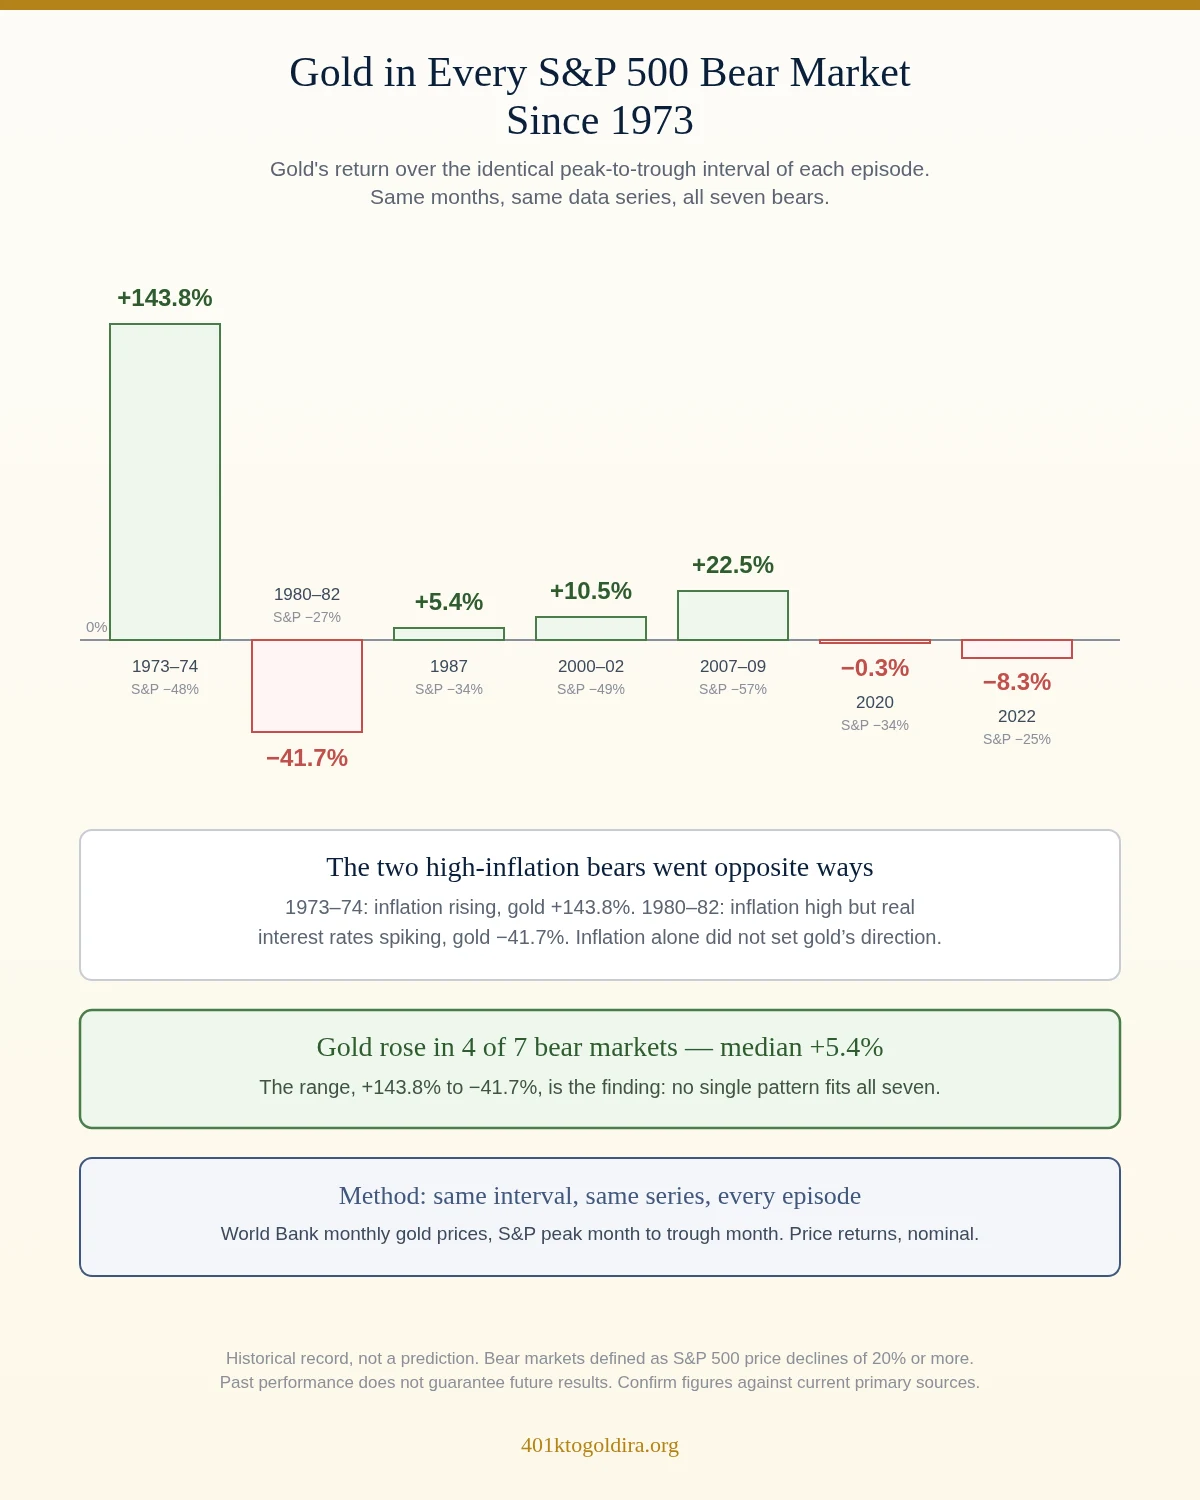
Gold rose in 4 of the 7 S&P 500 bear markets since 1973 — but outcomes ranged from +144.6% (1973–74) to −41.7% (1980–82) over the identical intervals.
Computed from World Bank Commodity Price Data (Pink Sheet) monthly gold prices over S&P 500 peak-to-trough intervals per Yardeni Research bear-market tables. The variance is the finding: no single pattern fits all seven episodes.
Key takeaways
- Gold rose in 4 of 7 bear markets (1973–74, 1987, 2000–02, 2007–09) and fell in 3 (1980–82, 2020, 2022). Median same-interval return: +5.4%.
- The two high-inflation bears went opposite ways: +144.6% in 1973–74, −41.7% in 1980–82 as real interest rates rose sharply.
- In the 2022 bear market, with CPI above 7%, gold fell 8.3% — high inflation alone did not determine gold's direction.
- Bear markets and recessions are separate events with different dates; this dataset tracks equity bear markets only.
- Every figure is computed from named public series with the calculation rule stated. Cells that could not be verified are labelled, not estimated.
What Counts as a Bear Market in This Dataset?
A bear market here is a decline of 20% or more in the S&P 500 price index from a closing peak to a closing trough. That definition follows the bear-market register compiled by Yardeni Research from Standard & Poor's data. Corrections of 10–19.9% are excluded.
The dataset begins with the 1973–1974 episode for a structural reason. Under the Bretton Woods system, the US dollar was convertible into gold at a fixed $35 per ounce, so gold did not trade freely. That system ended on August 15, 1971, when dollar-to-gold convertibility was suspended (Federal Reserve History). The 1968–1970 equity bear market meets the 20% threshold but is excluded because gold was still price-fixed while it ran.
The Full Event Table: Seven Bear Markets, Seven Gold Intervals
Gold returns are measured from the month of each S&P 500 peak to the month of its trough, using the World Bank Pink Sheet monthly gold series (US dollars per troy ounce, LBMA PM benchmark basis). Equity declines are price-index figures.
| Episode | Peak → trough | S&P 500 decline | Gold, same interval | Recession overlap | CPI at peak → trough |
|---|---|---|---|---|---|
| 1973–1974 | Jan 11 1973 → Oct 3 1974 | −48.2% | +144.6% | Yes (1973–75) | +3.6% → +12.1% |
| 1980–1982 | Nov 28 1980 → Aug 12 1982 | −27.1% | −41.7% | Yes (1980; 1981–82) | +12.6% → +5.9% |
| 1987 crash | Aug 25 1987 → Dec 4 1987 | −33.5% | +5.4% | No | +4.3% → +4.4% |
| 2000–2002 dot-com | Mar 24 2000 → Oct 9 2002 | −49.1% | +10.8% | Partial (2001) | +3.8% → +2.0% |
| 2007–2009 financial crisis | Oct 9 2007 → Mar 9 2009 | −56.8% | +22.5% | Yes (Dec 07–Jun 09) | +3.5% → −0.4% |
| 2020 COVID-19 shock | Feb 19 2020 → Mar 23 2020 | −33.9% | −0.3% | Yes (Feb–Apr 20) | +2.3% → +1.5% |
| 2022 rate-hike bear | Jan 3 2022 → Oct 12 2022 | −25.4% | −8.3% | No (none declared) | +7.5% → +7.7% |
Recession overlap uses the NBER business-cycle chronology. CPI figures are year-over-year CPI-U from BLS data, measured at the peak month and trough month of each episode.
1990 borderline episode: some market-history tables classify the July–October 1990 decline as a bear market after rounding it to −20.0%. The Yardeni series used for this dataset records that decline at −19.9%, below the stated ≥20% inclusion threshold, so it is excluded. Classification of that episode depends on the source and rounding convention used.
Download the Bear-Market Dataset (CSV)
What Are the Summary Numbers?
| Metric | Value |
|---|---|
| S&P 500 bear markets since 1973 | 7 |
| Episodes where gold rose | 4 (1973–74, 1987, 2000–02, 2007–09) |
| Episodes where gold fell | 3 (1980–82, 2020, 2022) |
| Median gold return during bear markets | +5.4% |
| Best episode for gold | 1973–74: +144.6% |
| Worst episode for gold | 1980–82: −41.7% |
Every figure above is computed from the event table; no statistics are imported from external studies.
In Which Bear Markets Did Gold Rise — and in Which Did It Fall?
The four rising episodes differ from each other as much as they differ from the falling ones. Gold's +144.6% in 1973–74 came as inflation climbed from under 4% to above 12% in the first years of free-floating gold prices. The +22.5% through the 2007–09 financial crisis came in a low-inflation environment that ended in outright deflation. The 1987 crash and the dot-com bust produced modest single-digit and low-double-digit gains.
The falling episodes are at least as instructive. In 1980–82, gold lost 41.7% during an equity bear market that began with inflation above 12% — the sharp rise in real interest rates that followed drew capital away from metal that pays no yield. In the 2020 COVID shock, gold finished the five-week equity collapse essentially flat at −0.3%, and academic studies using daily data found it fell alongside stocks on many of the worst individual days before recovering within the month. In 2022, with inflation above 7% all year, gold declined 8.3% as rates rose.
Put together: the two high-inflation bear markets produced gold's best and worst episodes. High inflation alone did not determine gold's direction — the level and direction of real interest rates mattered at least as much. The year-by-year version of that relationship, across all 55 years rather than only bear-market intervals, is in the companion gold vs inflation dataset.
Why Does This Dataset Separate Bear Markets From Recessions?
Bear markets and recessions overlap in history but are different events with different dates. A bear market is an equity price event. A recession, as dated by the NBER Business Cycle Dating Committee, is a broad decline in economic activity. The 1987 crash reached bear-market depth with no recession at all; the 2001 recession covered only part of the 2000–02 bear; and the 2022 bear market has no declared recession beside it.
Datasets that blend the two event lists produce muddled conclusions, because "how does gold behave in a recession" and "how does gold behave when stocks fall 20%" are different questions with different answers. This page answers only the second. The recession column is context, not a merged event list.
What Does the Academic Research Add?
Studies using daily and intraday data add a layer the monthly event table cannot show. Research on the COVID-19 period found gold's negative correlation with major equity indices was strongest in the initial phase of the crisis and weakened after large fiscal and monetary interventions, with one study concluding that "there is no universally applicable safe haven" (peer-reviewed study). A separate analysis of the Thai market reached a similar verdict for that crisis (AJMI).
Where the phrase "safe haven" appears on this page, it is the terminology of the cited studies, not a conclusion of the dataset. The dataset records what happened; it does not assert that any pattern will repeat.
How Does This Relate to Portfolio Allocation?
An event table is a building block, not an allocation tool. The companion analysis at the gold allocation backtest examines how portfolios holding 0–25% gold performed across rolling periods, which is the allocation-level version of this question. Readers thinking about sequence risk near retirement may also find the market-crash-before-retirement guide and 401(k) crash-preparation guide relevant, and the gold IRA vs ETF comparison covers the implementation wrappers.
How Was This Dataset Verified? (Methodology)
- Bear-market definition: S&P 500 price-index decline of ≥20%, closing peak to closing trough, per the Yardeni Research register from Standard & Poor's data. Price return, not total return: drawdown magnitude is conventionally tracked on a price basis. No total-return figures appear on this page.
- Gold series: World Bank Commodity Price Data (Pink Sheet), monthly gold price, USD per troy ounce, LBMA PM benchmark basis. Computed August 21, 2026 from the current monthly file edition (observations 1960 through 2026M07; the 1960 value of $35 matches the Bretton Woods parity as a spot check). Only the observations corresponding to the seven bear-market intervals are used.
- Calculation rule: gold return = (price in the S&P trough month ÷ price in the S&P peak month) − 1. Nominal, same-interval, no annualisation.
- Granularity limitation: the Pink Sheet series is monthly averages, so intervals run month-of-peak to month-of-trough. Returns computed from daily PM-fix data would differ slightly. The monthly basis is applied identically to all seven episodes.
- CPI: BLS CPI-U (series CUUR0000SA0), year-over-year, measured at each episode's peak month and trough month.
- Start date: 1973, because gold was price-fixed under Bretton Woods until August 1971 and the 1968–70 bear ran while the parity held.
- Honesty rule: where a figure could not be computed from a named primary series, the cell is labelled rather than estimated. Past episodes do not predict future ones.
Assumptions and Limitations
Monthly averaging smooths intra-month extremes: gold's sharp fall and recovery inside March 2020 largely nets out in a monthly series, which is why the daily-data studies cited above add necessary nuance. Nominal returns are shown; deflating by CPI would lower the real outcome of every positive episode and deepen every negative one, most materially in the 1970s. Index vendors and the NBER can revise chronologies, so each figure carries the date it was computed. Public sources change; the dataset should be re-verified periodically.
Reviewed and edited by Daniel M. — Editor, 401kToGoldIRA.org.
Update History
- August 2026: Initial publication. Equity episodes from Yardeni Research and Wells Fargo Advisors tables; gold intervals computed from the World Bank Pink Sheet monthly series; CPI context from BLS API data. Later the same month, gold intervals were recomputed from the World Bank's current file edition (data through 2026M07), refining two episodes slightly (1973–74 and 2000–02); the whole table is recomputed, not patched, whenever the source edition refreshes.
FAQ
How has gold performed during S&P 500 bear markets?
Across the seven bear markets since 1973, gold rose in four and fell in three, with same-interval returns from +144.6% to −41.7% and a median of +5.4%. Outcomes varied widely by episode.
Why does the dataset start after 1971?
Gold was fixed at $35 per ounce under Bretton Woods until August 1971, so earlier comparisons mix a fixed parity with market prices. The first bear market fully inside the free-trading era began in January 1973.
Did gold protect investors in high-inflation bear markets?
The record is split: +144.6% in 1973–74, −41.7% in 1980–82, −8.3% in 2022. All three ran with elevated inflation. The direction of real interest rates mattered at least as much as the inflation level.
What gold price series does this dataset use?
The World Bank Pink Sheet monthly gold series in US dollars per troy ounce, which follows the LBMA PM benchmark. The calculation rule and its monthly-granularity limitation are stated in the methodology.
Is gold a safe haven during stock market crashes?
This page does not assert that conclusion in either direction. The cited academic studies found gold's protective behaviour varied within and across crises, and the episode table shows both rising and falling outcomes.
Does a bear market mean a recession?
No. The 1987 crash and the 2022 bear market reached the 20% threshold with no NBER recession declared. The dataset keeps the two event types separate and flags overlap as context only.
Further Reading
 Gold Allocation BacktestHow 0–25% gold allocations performed in a 60/40 portfolio across rolling periods.
 A Market Crash Right Before RetirementSequence-of-returns risk and the decisions that matter in the final years.
 Gold IRA vs Gold ETFCost crossover analysis between physical metal wrappers and funds.