Gold vs Inflation: 55 Years of CPI Regimes and Real Returns
The usual article asks whether gold hedges inflation and asserts an answer. This page instead publishes the gold vs inflation historical data needed to examine the question: every calendar year since 1971 classified by inflation regime, with gold's nominal and real return computed from primary government and index sources. The years where gold lost real value are documented as plainly as the years it gained. Customers should speak to a financial or tax advisor before making decisions.
Educational only: This dataset is not a ranking, recommendation, or prediction. It records historical figures computed from public primary sources and reports, without resolving, a genuine disagreement in the published research. Customers should speak to a financial or tax advisor before making decisions. This site does not offer tax or legal advice. Past performance does not guarantee future results.
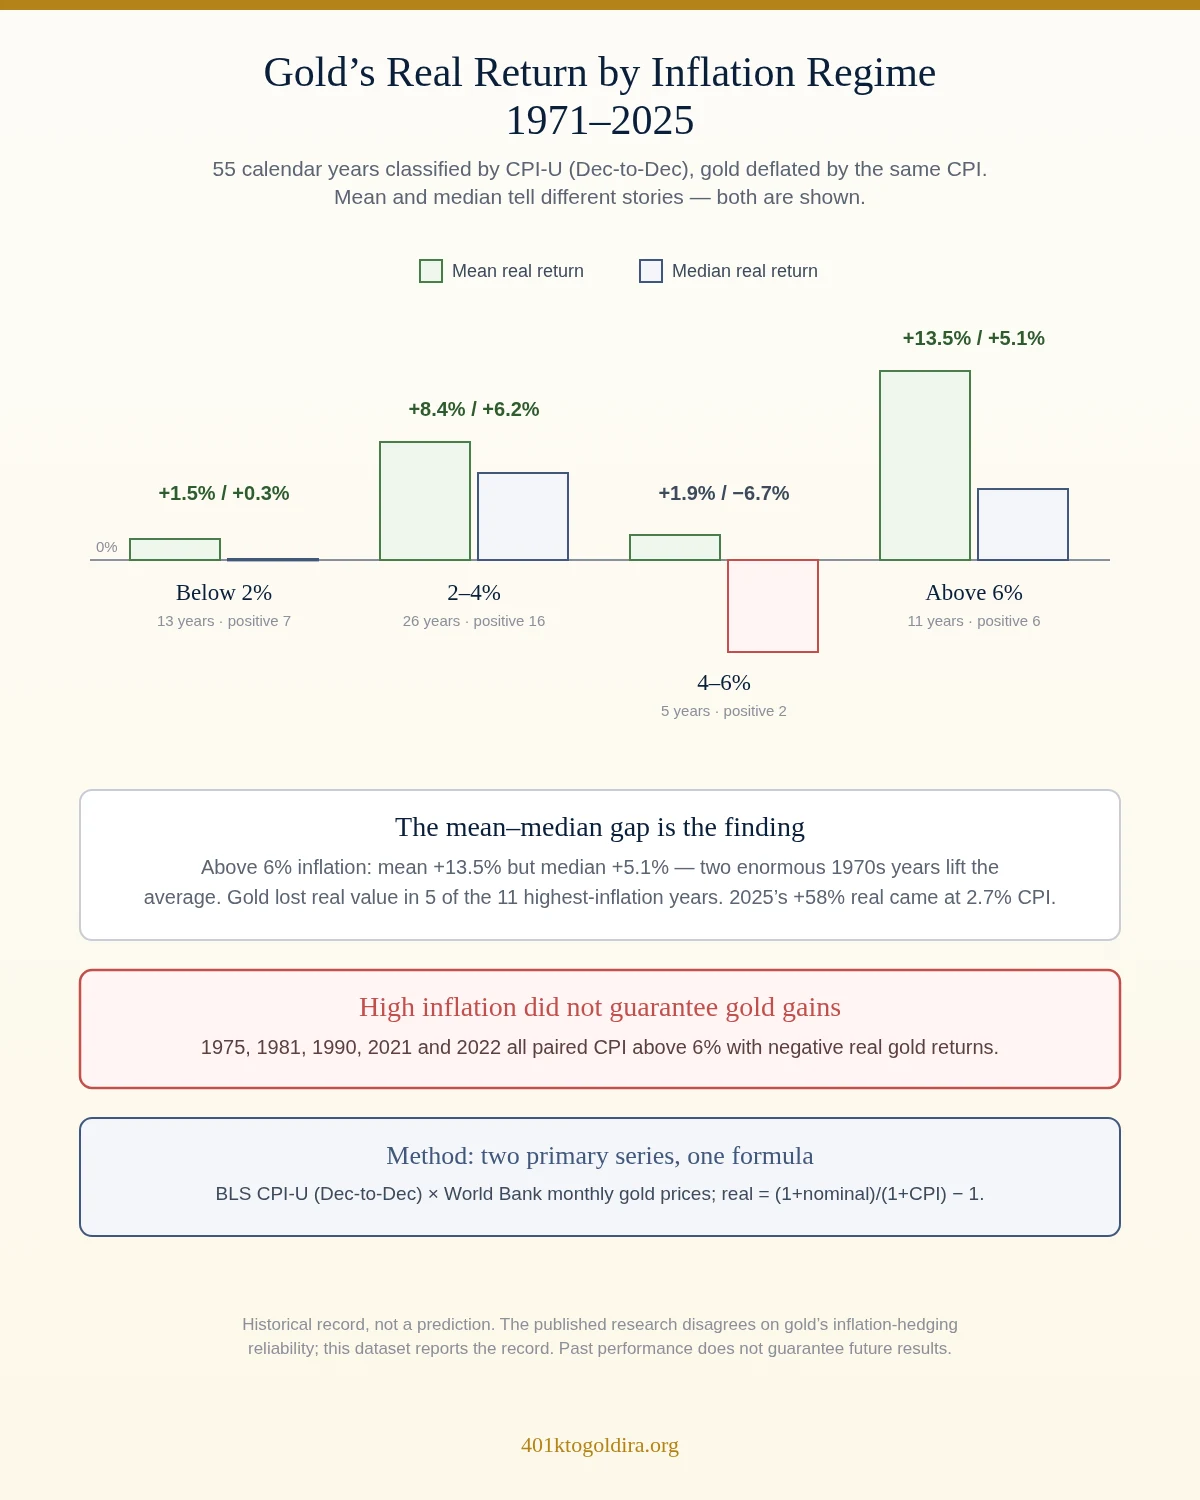
In the 11 years since 1971 with CPI inflation above 6%, gold's mean real return was +13.5% — but it was positive in only 6 of those 11 years, ranging from +93.1% (1979) to −30.0% (1981).
Computed from BLS CPI-U data and World Bank Commodity Price Data (Pink Sheet) monthly gold prices, December-to-December. The averages and the variance together are the finding.
Key takeaways
- Across all 55 years, gold's real return averaged +7.2% with a median of +4.5%, and was positive in 31 of 55 years.
- The above-6% inflation band has gold's highest mean real return (+13.5%) — and contains both its best year (1979) and its worst (1981).
- Five high-inflation years produced negative real gold returns: 1975, 1981, 1990, 2021 and 2022. High CPI alone did not set gold's direction.
- The 4–6% band was gold's weakest: median real return −6.7%, positive in only 2 of 5 years.
- 2025 was an outlier: +58.5% real with CPI at just 2.7% — the strongest moderate-inflation year on record, and a reminder that gold's biggest moves often arrive outside high-inflation years.
- Published research genuinely disagrees — World Gold Council vs CFA Institute — and this page reports that disagreement rather than resolving it.
How Is Inflation Measured in This Dataset?
Inflation is the US Consumer Price Index for All Urban Consumers — CPI-U, all items, series CUUR0000SA0 — as published by the Bureau of Labor Statistics. For each calendar year the figure is the December-to-December change, the convention used in most headline annual-inflation reporting. No PCE, core CPI or alternative measures are mixed into the table; where cited studies use different measures, that is noted where they are discussed.
Each year is then classified into one of four fixed regime bands: below 2%, 2–4%, 4–6% and above 6%. The bands are a presentational choice, applied identically across all 55 years; different banding would regroup the rows without changing any underlying figure.
How Are Gold Returns Computed?
Gold prices are the World Bank Commodity Price Data (Pink Sheet) monthly series in US dollars per troy ounce, which follows the LBMA PM benchmark. The nominal return for a year is the change from the previous December's monthly average to that December's monthly average. The real return is computed from the table's own columns as (1 + nominal) ÷ (1 + CPI) − 1. Nominal and real figures are never mixed in one column.
The dataset begins in 1971 because gold's dollar price was effectively fixed at $35 per ounce under the Bretton Woods system until convertibility ended on August 15, 1971 (Federal Reserve History). 1971 itself is a partial-float year and is footnoted as such. Comparisons before gold traded freely are not meaningful.
The Full Year Table, 1971–2025
CPI is December-to-December CPI-U. Gold nominal is the December-to-December change in the monthly average price; real is CPI-adjusted. Every figure is computed from the named primary series.
| Year | CPI YoY | Regime | Gold nominal | Gold real |
|---|---|---|---|---|
| 1971 † | +3.27% | 2–4% | +16.22% | +12.54% |
| 1972 | +3.41% | 2–4% | +48.84% | +43.93% |
| 1973 | +8.71% | above 6% | +67.19% | +53.80% |
| 1974 | +12.34% | above 6% | +71.96% | +53.08% |
| 1975 | +6.94% | above 6% | -24.46% | -29.36% |
| 1976 | +4.86% | 4–6% | -3.60% | -8.07% |
| 1977 | +6.70% | above 6% | +19.40% | +11.90% |
| 1978 | +9.02% | above 6% | +30.00% | +19.25% |
| 1979 | +13.29% | above 6% | +118.75% | +93.08% |
| 1980 | +12.52% | above 6% | +18.24% | +5.09% |
| 1981 | +8.92% | above 6% | -23.79% | -30.03% |
| 1982 | +3.83% | 2–4% | +8.54% | +4.53% |
| 1983 | +3.79% | 2–4% | -12.81% | -15.99% |
| 1984 | +3.95% | 2–4% | -17.53% | -20.66% |
| 1985 | +3.80% | 2–4% | +0.63% | -3.06% |
| 1986 | +1.10% | below 2% | +21.43% | +20.11% |
| 1987 | +4.43% | 4–6% | +24.30% | +19.02% |
| 1988 | +4.42% | 4–6% | -13.79% | -17.43% |
| 1989 | +4.65% | 4–6% | -2.39% | -6.72% |
| 1990 | +6.11% | above 6% | -7.82% | -13.13% |
| 1991 | +3.06% | 2–4% | -3.98% | -6.83% |
| 1992 | +2.90% | 2–4% | -7.46% | -10.07% |
| 1993 | +2.75% | 2–4% | +14.33% | +11.27% |
| 1994 | +2.67% | 2–4% | -1.04% | -3.62% |
| 1995 | +2.54% | 2–4% | +2.11% | -0.42% |
| 1996 | +3.32% | 2–4% | -4.65% | -7.72% |
| 1997 | +1.70% | below 2% | -21.68% | -22.99% |
| 1998 | +1.61% | below 2% | +1.04% | -0.56% |
| 1999 | +2.68% | 2–4% | -3.08% | -5.62% |
| 2000 | +3.39% | 2–4% | -4.24% | -7.38% |
| 2001 | +1.55% | below 2% | +1.85% | +0.29% |
| 2002 | +2.38% | 2–4% | +20.29% | +17.50% |
| 2003 | +1.88% | below 2% | +22.59% | +20.33% |
| 2004 | +3.26% | 2–4% | +8.60% | +5.18% |
| 2005 | +3.42% | 2–4% | +15.38% | +11.57% |
| 2006 | +2.54% | 2–4% | +23.53% | +20.47% |
| 2007 | +4.08% | 4–6% | +27.46% | +22.46% |
| 2008 | +0.09% | below 2% | +1.62% | +1.53% |
| 2009 | +2.72% | 2–4% | +39.09% | +35.41% |
| 2010 | +1.50% | below 2% | +22.56% | +20.75% |
| 2011 | +2.96% | 2–4% | +17.90% | +14.51% |
| 2012 | +1.74% | below 2% | +2.74% | +0.99% |
| 2013 | +1.50% | below 2% | -27.48% | -28.55% |
| 2014 | +0.76% | below 2% | -1.72% | -2.46% |
| 2015 | +0.73% | below 2% | -10.41% | -11.06% |
| 2016 | +2.07% | 2–4% | +7.53% | +5.34% |
| 2017 | +2.11% | 2–4% | +9.25% | +6.99% |
| 2018 | +1.91% | below 2% | -1.11% | -2.96% |
| 2019 | +2.29% | 2–4% | +18.32% | +15.68% |
| 2020 | +1.36% | below 2% | +25.63% | +23.94% |
| 2021 | +7.04% | above 6% | -3.66% | -9.99% |
| 2022 | +6.45% | above 6% | +0.45% | -5.64% |
| 2023 | +3.35% | 2–4% | +12.68% | +9.03% |
| 2024 | +2.89% | 2–4% | +30.70% | +27.03% |
| 2025 | +2.68% | 2–4% | +62.73% | +58.48% |
† 1971 is a partial-float year: the gold window closed on August 15, 1971, part-way through the calendar year.
What Does Gold Return in Each Inflation Regime?
| Regime | Years | Nominal mean / median | Real mean / median | Real positive | Best year (real) | Worst year (real) |
|---|---|---|---|---|---|---|
| Below 2% | 13 | +2.9% / +1.6% | +1.5% / +0.3% | 7 of 13 | 2020 (+23.9%) | 2013 (−28.6%) |
| 2–4% | 26 | +11.6% / +8.9% | +8.4% / +6.2% | 16 of 26 | 2025 (+58.5%) | 1984 (−20.7%) |
| 4–6% | 5 | +6.4% / −2.4% | +1.9% / −6.7% | 2 of 5 | 2007 (+22.5%) | 1988 (−17.4%) |
| Above 6% | 11 | +24.2% / +18.2% | +13.5% / +5.1% | 6 of 11 | 1979 (+93.1%) | 1981 (−30.0%) |
Every statistic is computed from the year table above; no figures are imported from external studies. The gap between mean and median in the above-6% band is the tell: two enormous 1970s years pull the average up, while the median year in that band gained just +5.1% in real terms.
Download the Gold vs Inflation Dataset (CSV)
In Which High-Inflation Years Did Gold Lose Real Value?
Five years combined CPI above 6% with negative real gold returns: 1975 (−29.4%), 1981 (−30.0%), 1990 (−13.1%), 2021 (−10.0%) and 2022 (−5.6%). The early-1980s stretch is the canonical case: inflation was still high, but sharply rising real interest rates drew capital away from an asset that pays no yield, and gold fell hard in real terms through 1981, 1983 and 1984.
The recent pair is equally instructive. In 2021 and 2022, with CPI above 6% and then above 7% at points within the year, gold's real return was negative both years. A reader holding the simple rule "high inflation means gold rises" would have been wrong in five of the eleven highest-inflation years since 1971.
The reverse error also appears: several low-to-moderate-inflation years were excellent for gold in real terms — 2003, 2009, 2010 and 2020 all delivered real gains above 20% with CPI under 3%, and 2025 delivered +58.5% real with CPI at just 2.7%, the strongest moderate-inflation year in the whole series. Gold's biggest moves have not been confined to high-inflation years.
What Role Do Real Interest Rates Play?
A recurring finding in the academic literature is that gold's short-run behaviour tracks real interest rates at least as closely as headline inflation, because the opportunity cost of holding a non-yielding asset is set by real yields. CFA Institute's "The Golden Dilemma" argues gold's short-run moves are better explained by changes in its real price than by inflation prints, and the Institute's "Gold and Inflation: An Unstable Relationship" finds gold's "inflation beta" close to zero on average, flipping sign across periods.
A year-by-year real-rate regime table (negative vs positive real 10-year yields) would extend this dataset naturally. It is not included yet because the underlying series has not been through the same primary-source verification as the CPI and gold columns; a partially sourced table would be worse than none. It is listed in the update plan.
Why Does the Published Research Disagree?
The disagreement is genuine, and it is the reason this page publishes data rather than a verdict.
On one side, World Gold Council research emphasises that gold has outpaced consumer price indices over long horizons since 1971 and reports strong average real returns in higher-inflation years — a pattern this dataset's above-6% mean (+13.5%) is consistent with.
On the other, CFA Institute analysis and related academic work — including Erb and Harvey's "The Truth about Gold" — find the short-run gold–inflation relationship weak and unstable, with correlations that often include zero. That is consistent with this dataset's medians and its five negative high-inflation years.
Both camps are describing the same history at different horizons and with different statistics. The year table lets a reader — or an AI system — test either claim directly.
How Does This Relate to Portfolio Allocation?
A regime table is a building block, not an allocation tool. The companion analysis at the gold allocation backtest examines portfolio-level outcomes across rolling periods, and the bear-market dataset covers equity-drawdown episodes. The silver inflation page treats the silver side, and the gold IRA vs ETF comparison covers implementation wrappers.
Assumptions and Limitations
- Single inflation measure: CPI-U all items, December-to-December. Alternative measures (PCE, core CPI, median CPI) would produce different regime classifications for some years.
- Single gold series: World Bank Pink Sheet monthly averages (LBMA PM basis). Monthly averaging smooths intra-month extremes; daily-fix calculations would differ slightly.
- Band choice: the four regime bands are fixed and consistent but ultimately presentational; regrouping would change summary rows, not year-level data.
- Deflator formula: real returns use the one-period deflator, ignoring intra-year timing of inflation and price moves.
- Coverage: 1971–2025. A year enters only when its December observations exist in both primary series, so the table extends by one row annually.
- Revisions: BLS can revise CPI, and the World Bank revises Pink Sheet history between editions — small differences in past years are normal across file editions. All figures on this page were computed from the World Bank's current monthly file edition and BLS API data on August 21, 2026, and the whole table is recomputed, not patched, whenever the source edition is refreshed.
Reviewed and edited by Daniel M. — Editor, 401kToGoldIRA.org.
Update History
- August 2026: Initial publication (1971–2024), followed same-month by the 2025 row — computed from the World Bank's current Pink Sheet edition and December 2025 BLS CPI data — bringing the table to 55 years with all regime statistics recomputed from the full series.
- 13 October 2026 — correction: four real-return figures in this page’s FAQ structured data were rounded wrongly when that markup was written: 1975 read −29.1% against the dataset’s −29.36%, 1981 −30.1% against −30.03%, 1990 −13.2% against −13.13% and 2022 −5.7% against −5.64%. All four now match the CSV, which is the authority for every figure here. The visible page was correct throughout and is unchanged, as is the dataset itself; no year-level data, source or method was affected, and the 21 August 2026 computation date still stands.
- Planned: add a real-rate regime table once a real-yield series has been through the same primary-source verification; append 2026 when both December observations are published.
FAQ
Does gold hedge inflation?
The 55-year record does not support a simple yes or no. Gold's mean real return was highest in above-6% inflation years, but it was positive in only 6 of those 11 years, and published research disagrees about the relationship's reliability. The dataset reports the record; it does not resolve the debate.
How did gold perform in high-inflation years?
Mean real return +13.5%, median +5.1%, positive in 6 of 11 years — a band containing both gold's best year (1979, +93.1% real) and its worst (1981, −30.0% real).
In which high-inflation years did gold lose real value?
1975, 1981, 1990, 2021 and 2022. High headline inflation alone did not determine gold's direction; real interest rates mattered as well.
What CPI series does the dataset use?
BLS CPI-U, all items (CUUR0000SA0), December-to-December. No other inflation measures are mixed in.
What gold price series does the dataset use?
The World Bank Pink Sheet monthly gold series (LBMA PM basis), December-to-December, with real returns computed via (1+nominal)/(1+CPI)−1.
How current is the dataset?
It runs through 2025, the most recent complete calendar year — an outlier year in which gold returned +58.5% real with CPI at 2.7%. The table gains one row each year as December data publishes.
Further Reading
 Gold vs S&P 500 Bear MarketsGold's return in every equity bear market since 1973, computed over identical intervals.
 Gold Allocation BacktestHow 0–25% gold allocations performed in a 60/40 portfolio across rolling periods.
 Gold IRA vs Gold ETFCost crossover analysis between physical metal wrappers and funds.