Sequence-of-Returns Risk Calculator: Same Average, Different Outcome
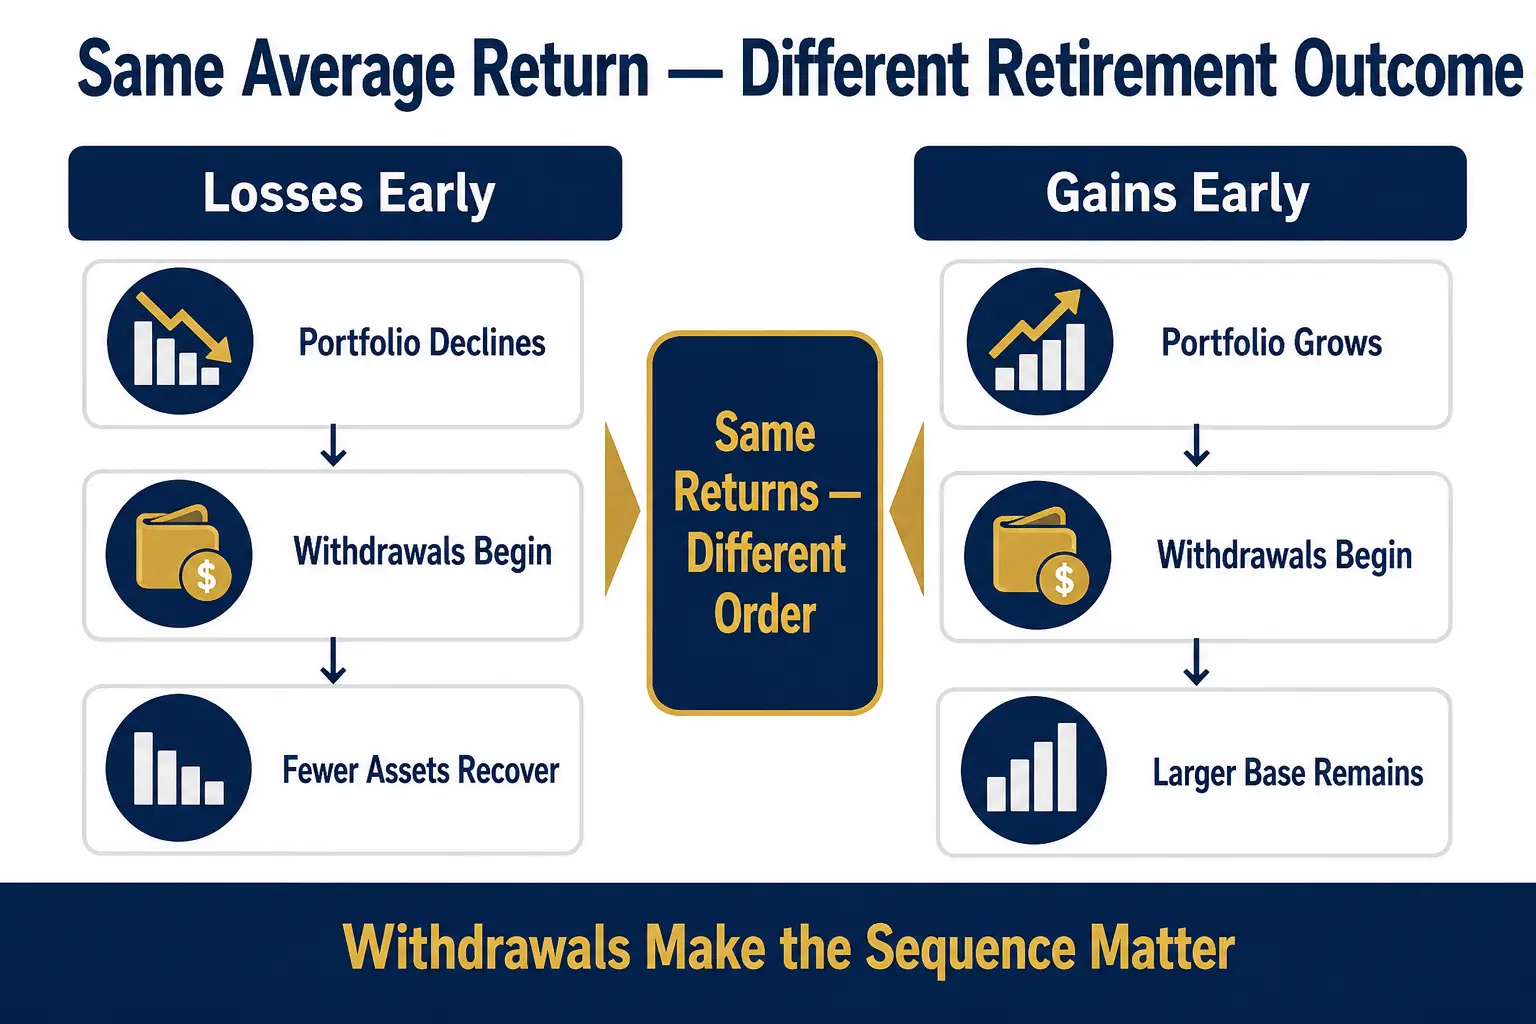
This sequence-of-returns risk calculator compares two retirement portfolios with the same starting balance, the same set of annual returns, and the same withdrawals — but in the opposite order. It shows why a loss early in retirement can leave a portfolio far smaller than one that sees the same returns later, even when the average return is identical. It is an educational illustration of a concept, not a forecast or recommendation.
Open the Calculator →Educational only: This tool produces illustrative estimates based on assumptions the user enters to demonstrate a mathematical concept. It is not financial, tax, or legal advice, not a forecast of any portfolio, and not a recommendation of any strategy or product. Actual returns are unpredictable and vary. Customers should speak with a financial or tax advisor before making decisions. Goldco does not offer tax or legal advice. Past performance does not guarantee future results.
Quick Answer: What This Calculator Demonstrates
Sequence-of-returns risk is the risk created by the order in which investment returns occur. During the saving years, with no withdrawals, two portfolios with the same average return finish at the same value regardless of order, because reversing a series of multiplications does not change the product. Once withdrawals begin, that changes. A portfolio that experiences its worst years first sells assets from a smaller base and has fewer assets left when stronger returns arrive. This calculator makes that visible: it runs the same set of annual returns forward and in reverse against the same starting balance and the same annual withdrawal, then shows how different the ending balances can be.
Sequence-of-Returns Illustration
Enter a starting balance, an annual withdrawal, and a short series of annual returns (comma-separated percentages). The tool applies those returns in order for Portfolio A and in reverse for Portfolio B, withdrawing the same amount each year from both. The average return is identical; only the order differs.
Enter 3–12 yearly returns separated by commas. Portfolio B uses the same numbers reversed.
"Portfolio A (losses early)" applies the returns in the order entered; "Portfolio B (gains early)" applies the same returns reversed. Both have the identical average return and the same withdrawal each year, so any difference in the ending balance comes only from the order of returns interacting with the withdrawals. The illustration excludes taxes, fees, inflation adjustments, and required distributions.
What Is Sequence-of-Returns Risk?
Sequence-of-returns risk is the risk created by the order of investment returns once a portfolio is being drawn down. The Center for Retirement Research at Boston College explains that negative returns early in retirement have a more severe effect because the portfolio is reduced by both market losses and withdrawals, leaving less money available for future growth (Center for Retirement Research at Boston College). Vanguard describes sequence risk as damage to lifetime spending power caused by withdrawing during a down market early in retirement (Vanguard).
The key point is that average return alone does not describe retirement sustainability. Two retirees can plan for the same long-run average and end up in very different places depending on when the weak years arrive. That is why the years just before and after the retirement date — often called the retirement "red zone" — carry outsized importance.
Why Does the Order Matter Only During Withdrawals?
During the saving years, an investor is usually adding money, not taking it out. A market decline can even help, because ongoing contributions buy more shares at lower prices, and reversing the order of a set of returns produces the same ending value. After retirement, contributions typically stop and withdrawals begin. When shares are sold after a loss, that loss becomes part of the retirement cash-flow plan, and those shares are no longer present when prices recover. Investor.gov encourages people nearing retirement to consider whether a portfolio should become less aggressive before withdrawals begin, precisely because a downturn can arrive at an inconvenient time (Investor.gov).
This calculator is a companion to the article on a market crash right before retirement, which explains the concept and the planning tools in depth. This tool lets a reader put their own numbers into the same idea.
Compare the full toolkit
This is one of several educational calculators covering fees, RMDs, allocation, break-even, and more.
See All Calculators →How Can a Retiree Reduce Sequence-of-Returns Risk?
No single step removes sequence risk, but several can reduce the damage. A cash or short-term buffer can fund near-term spending so a retiree avoids selling growth assets into a loss. Flexible withdrawal guardrails let spending fall modestly after weak years and rise after strong ones. Delaying retirement or Social Security shortens the drawdown period and can raise scheduled income. Diversification spreads the portfolio across assets with different return drivers. Each of these is a consideration, not a guarantee, and the right mix depends on the full plan.
- Cash / bucket buffer: hold near-term spending outside volatile assets. See the retirement portfolio longevity guide.
- Flexible withdrawals: set a spending floor and ceiling rather than one fixed, inflation-adjusted amount.
- Delay timing: even one or two more working years changes the cash-flow sequence.
- Diversify: spread across stocks, bonds, cash, and possibly a proportionate diversifier. The purchasing-power guide covers inflation alongside this.
Customers should speak to a financial or tax advisor before making decisions about withdrawals, asset allocation, or retirement timing. Goldco does not offer tax or legal advice.
Frequently Asked Questions
What does a sequence-of-returns risk calculator show?
It compares two retirement portfolios that have the same starting balance, the same set of annual returns, and the same withdrawals, but experience those returns in the opposite order. When money is being withdrawn, the portfolio that hits its losses early can end with far less, even though the average return is identical.
Why does the order of returns matter in retirement?
During withdrawals, a loss early in retirement reduces the portfolio through both the market decline and the withdrawal at the same time, leaving fewer assets to recover when stronger returns arrive later. During the saving years, with no withdrawals, the order of returns does not change the ending value.
Is sequence risk the same as market risk?
No. Market risk is the possibility that investments lose value. Sequence-of-returns risk is the added damage caused when poor returns occur near the start of withdrawals, so two retirees with the same average return can have very different outcomes.
Does this calculator predict future returns?
No. It uses illustrative return assumptions the user enters to demonstrate a mathematical concept. It is not a forecast, and past performance does not guarantee future results.
How can a retiree reduce sequence-of-returns risk?
Common responses include holding a cash or short-term buffer to avoid selling into a loss, using flexible withdrawal guardrails, delaying retirement or Social Security, and diversifying. No single approach removes the risk.
Methodology and Limitations
Methodology. The tool reads the comma-separated annual returns entered by the user. Portfolio A applies them in the order given; Portfolio B applies the identical list reversed. For each year, the portfolio is grown by that year's return and reduced by the annual withdrawal (before or after the return, per the timing selector). The average return shown is the simple arithmetic mean of the entered returns, which is identical for both portfolios because they use the same numbers. Balances are floored at zero if a portfolio is exhausted. The difference is Portfolio B's ending balance minus Portfolio A's.
Assumptions and limitations. This is a simplified illustration of one concept. It uses a short, fixed series of returns rather than a full market simulation, and it excludes taxes, fees, inflation adjustments to the withdrawal, required minimum distributions, and any contributions. Returns are assumptions chosen by the user, not a forecast, and real markets do not repeat a fixed sequence. This tool is educational only, is not a suitability assessment, and should support discussion with a qualified professional rather than serve as the basis for a decision. Past performance does not guarantee future results.
Tool reviewed and edited by Daniel M. — editor, 401kToGoldIRA.org. Educational only; not tax or legal advice. Concept sourced to the Center for Retirement Research at Boston College and Vanguard.