Educational only: This comparison summarizes BLS, FDIC, Federal Reserve, Investor.gov, FINRA, and independent research in general terms. It is not financial, tax, or legal advice, and it does not forecast prices. This comparison is not a forecast: gold does not always beat cash, and cash does not always preserve purchasing power after inflation. Customers should speak to a financial or tax advisor before making decisions. Goldco does not offer tax or legal advice. Past performance does not guarantee future results.
A non-interest-bearing $10,000 cash balance in 2025 had the purchasing power of only about $2,559 in 1980 dollars — cash keeps its printed number while inflation quietly erodes what it buys.
Source: U.S. Bureau of Labor Statistics — Purchasing Power of the Consumer Dollar. Gold and cash serve different roles; neither is a universal winner.
Key takeaways
- Cash wins on stability, liquidity, and FDIC insurance up to $250,000 per depositor, per bank, per ownership category — but deposit insurance does not protect against inflation.
- Inflation erosion is the core cash risk: the same balance buys steadily less over time even as the number on the statement stays put.
- Gold has no counterparty and may hold value over long periods, but it pays no income, carries premiums and spreads, and can fall in price.
- The inflation link is not guaranteed — a 2024 CFA Institute analysis found gold's inflation relationship was weak and unstable from 1979–2024.
- Most plans use both: cash for near-term spending and stability, a modest gold allocation for diversification — sized to the individual plan.
Quick Answer: Gold and Cash Serve Different Roles
Cash is usually stronger for near-term spending, emergencies, planned withdrawals, and money that cannot tolerate a price decline. Deposits at an FDIC-insured bank are covered up to at least $250,000 per depositor, per insured bank, per ownership category when the applicable requirements are met. Deposit insurance protects against bank failure; it does not protect against inflation (FDIC: Understanding Deposit Insurance).
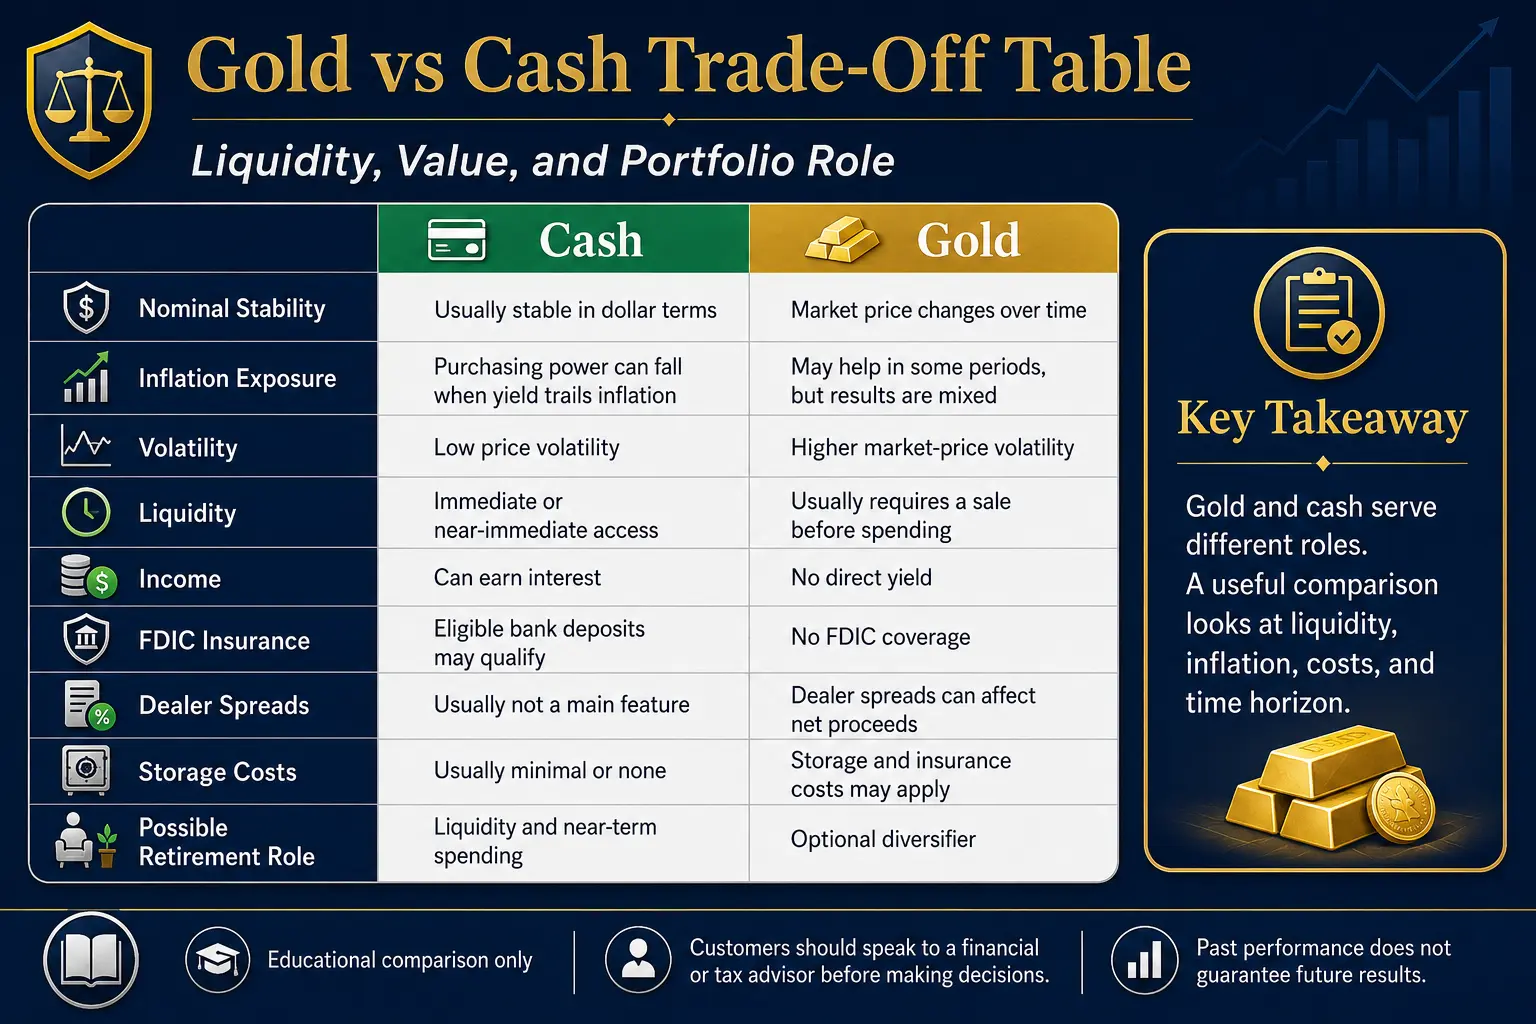
Gold is a traded asset rather than a bank deposit. It can rise or fall in dollar terms, pays no direct interest, and must normally be sold before it can fund spending. Physical gold can also include a retail premium, a dealer spread, storage, insurance, and administrative costs (FINRA: 10 Things to Ask Before Buying Physical Gold, Silver or Other Metals). The main trade-off can be summarized this way:
| Feature | Cash or bank savings | Physical gold |
|---|---|---|
| Nominal value | Usually stable in dollar terms | Market price changes |
| Purchasing power | Can fall when yield trails inflation | Can rise or fall after inflation |
| Income | Can earn interest | Pays no direct yield |
| Access | Immediate or near-immediate in many accounts | Requires a sale and settlement |
| Federal insurance | Eligible bank deposits may receive FDIC coverage | No FDIC coverage |
| Ownership costs | Account fees may apply, but storage is usually unnecessary | Premiums, spreads, storage, insurance, and administration may apply |
| Main portfolio role | Liquidity and near-term spending | Possible long-term diversifier |
| Main risk | Inflation can reduce real value | Price volatility and transaction costs |
The proper comparison is therefore not "safe versus unsafe" or "winning asset versus losing asset." It is a comparison between liquidity and nominal stability on one side and uncertain market appreciation with diversification potential on the other.
What Common Gold vs Cash Comparisons Often Miss
An editorial review of prominent pages ranking for gold-versus-cash and gold-versus-savings searches found several repeated themes. Many pages emphasize the long-run rise in consumer prices and selected periods when gold appreciated strongly. Some also compare one recent year of gold performance with one savings-account rate. Those comparisons can miss important details:
- Cash yields change with interest-rate conditions.
- A bank savings account is different from a money market mutual fund.
- FDIC insurance applies to eligible deposits, not to gold or mutual funds.
- Gold returns depend heavily on the starting and ending dates.
- Physical gold results should include the purchase premium, sale spread, storage, and insurance.
- Gold's record as an inflation hedge is mixed over normal retirement horizons.
- Cash and gold may have different jobs inside the same retirement plan.
A more useful gold vs cash historical comparison includes nominal value, inflation-adjusted value, fees, income, volatility, and liquidity. It also avoids selecting only the period that supports a preferred conclusion.
Purchasing Power: How Inflation Erodes Cash Over Time
Cash can keep the same number printed on a statement while buying fewer goods and services. The Bureau of Labor Statistics uses the Consumer Price Index for All Urban Consumers to measure average price changes for a broad basket of consumer goods and services. BLS explains that purchasing power can be compared across years by using CPI ratios, and its inflation calculator uses annual average CPI values (BLS: Purchasing Power and Constant Dollars).
The annual average CPI-U was 82.4 in 1980, 172.2 in 2000, and 321.943 in 2025 (BLS: Historical CPI-U, December 2025). Using those official index values:
- Prices in 2025 were about 3.91 times the 1980 level. A non-interest-bearing $10,000 cash balance in 2025 had purchasing power equal to about $2,559 in 1980 dollars.
- Prices in 2025 were about 1.87 times the 2000 level. A non-interest-bearing $10,000 balance in 2025 had purchasing power equal to about $5,349 in 2000 dollars.
These are CPI-based mathematical illustrations, not estimates of any household's exact cost of living. Personal spending patterns can differ from the CPI basket.
Cash Does Not Always Lose Ground
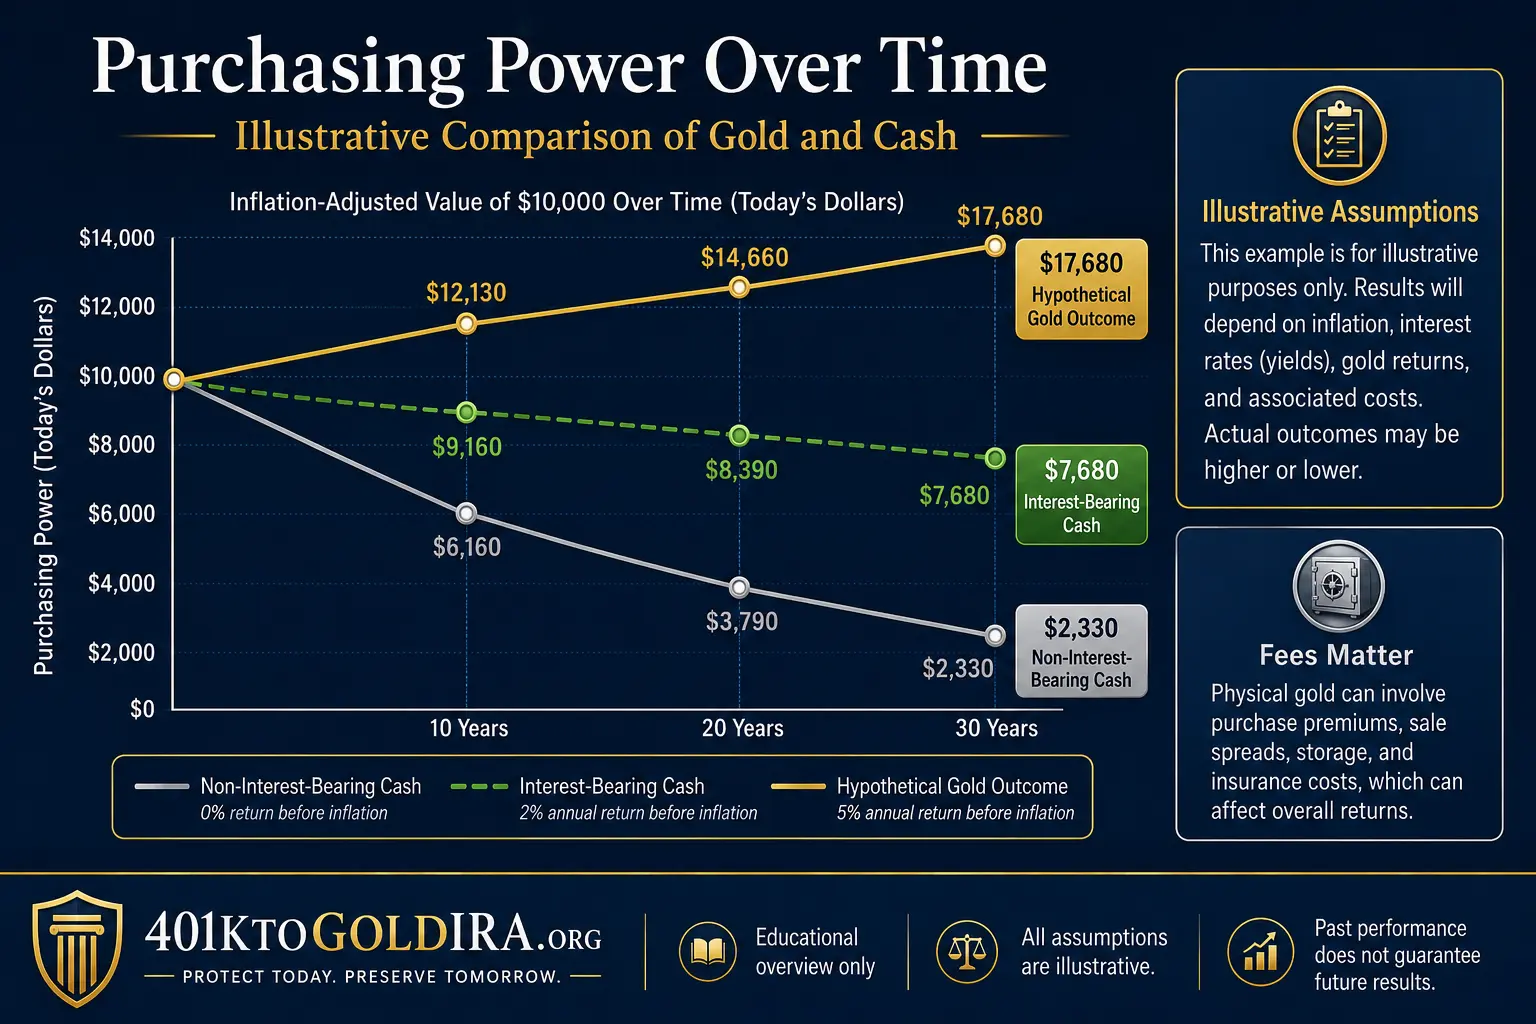
The phrase "cash losing value inflation" is incomplete when the cash earns interest. The real result depends on the relationship between the account yield, inflation, taxes, and fees. A savings account earning 4% while inflation is 2.5% has a positive pretax real return. An account earning 0.5% while inflation is 4% has a negative pretax real return.
Cash yields also change over time. The Federal Reserve Bank of St. Louis reports that the effective federal funds rate influences other interest rates, including savings rates. The monthly federal funds rate was 3.63% in June 2026, after being near zero during parts of 2020 and above 5% during parts of 2023 (FRED: Federal Funds Effective Rate). The FDIC's national averages as of May 18, 2026 were 0.38% for savings accounts, 0.57% for money market deposit accounts, and 1.55% for 12-month certificates of deposit. These are national averages, not the highest available rates, and individual institutions may pay more or less (FDIC: National Rates and Rate Caps, May 2026).
This difference matters in a gold vs savings account comparison. "Cash" can mean currency earning nothing, an ordinary savings account, a high-yield account, a certificate of deposit, a Treasury bill, or a money market fund. Those choices have different yields, access rules, insurance, and risks.
Volatility: Gold Moves While Cash Stays Nominally Stable
Gold has no fixed dollar value. Its market price changes each trading day. The World Gold Council maintains gold-price averages in major currencies back to 1978 and publishes return, correlation, and volatility data. World Gold Council research published in 2026 stated that annualized gold volatility was generally between 10% and 18% on most days in its historical analysis. The World Gold Council is an industry organization, so that finding should be considered alongside independent research and the underlying market data.
Gold's history includes both sharp advances and meaningful declines. An International Monetary Fund article notes that gold rose from about $217 per ounce in September 1978 to $850 in January 1980. An LBMA article notes that gold fell about 30% during 2013. Those episodes show why gold vs cash long term results can depend on the purchase date. A buyer near a gold-market high can experience a long wait before recovering purchasing power. A buyer before a strong advance can record a much better result.
Cash held in an insured deposit account does not normally show that kind of day-to-day price movement. A $10,000 deposit remains $10,000 before interest, withdrawals, and fees. Its risk is less visible: inflation can reduce what the balance buys. Gold vs cash volatility is therefore a comparison between visible market-price changes and gradual real-value changes that may not appear on a statement.
Liquidity and Income: Where Cash Has Clear Advantages
Cash is designed for payment. Funds in a checking or savings account can usually cover bills without selling an asset first. Certificates of deposit may impose an early-withdrawal penalty, but their maturity value and interest terms are defined in advance. Eligible bank deposits can also receive FDIC insurance within applicable limits.
Gold must be converted into cash before it can pay a normal household expense. The sale price may be below the quoted retail purchase price because dealers commonly buy below spot or below their own retail selling price. FINRA calls the difference between purchase and repurchase pricing the spread and advises obtaining the spot value, retail price, commissions, fees, and immediate repurchase amount in writing (FINRA: 10 Things to Ask Before Buying Physical Gold, Silver or Other Metals).
Cash can also produce income. Savings accounts, CDs, Treasury bills, and many money market instruments pay interest. Physical gold pays no direct yield. Its result depends on price appreciation after ownership and transaction costs.
Bank Money Market Accounts and Money Market Funds Are Different
A money market deposit account is a bank deposit and may qualify for FDIC insurance. A money market mutual fund is an investment company product. Investor.gov states that money market funds are not FDIC-insured and can lose value, even though they usually seek to maintain a stable share price and invest in short-term debt. That distinction should be built into any gold vs money market comparison.
Historical Perspective: Gold vs Cash Over Decades
A long historical comparison needs careful definitions. Gold price data generally reports changes in the market value of the metal. Cash results depend on where the cash was held and whether interest was reinvested. Comparing gold with currency earning zero is different from comparing gold with rolling Treasury bills, high-yield savings accounts, or certificates of deposit.
Gold Can Preserve Value Over Some Long Periods
World Gold Council research argues that gold has maintained purchasing power over very long horizons and can support portfolio diversification. Its historical data extends to 1978 for standard modern price comparisons. That conclusion has support in periods when gold appreciated faster than consumer prices. It does not mean every ten-year or twenty-year holding period produced the same outcome.
Gold's Inflation-Hedge Record Is Mixed
The World Gold Council describes gold as a strategic inflation hedge over longer periods while acknowledging that the short-term relationship is less convincing. Because the organization represents the gold industry, its research should be read with independent evidence. An NBER paper titled "The Golden Dilemma" reached a more cautious conclusion. It found that gold may act as an inflation hedge over horizons measured in centuries but was unreliable over practical investment periods. A 2024 CFA Institute analysis also found that gold's average inflation relationship was weak and unstable from 1979 through 2024, even though some periods showed stronger inflation sensitivity.
The balanced conclusion is that gold inflation hedge vs cash results are period-dependent. Gold may protect purchasing power during some inflation environments and fail to do so during others. Cash can also protect purchasing power when interest exceeds inflation, but not when its after-tax yield falls short.
When Holding More Cash Can Make Sense
Holding cash can be reasonable when the money has a short time horizon or a defined purpose. Examples include emergency reserves, planned expenses during the next few years, near-term retirement withdrawals, tax payments, home repairs or medical expenses, funds waiting for a scheduled investment or distribution, and money that cannot tolerate a temporary market decline.
Investor.gov describes cash and cash equivalents as the lowest-volatility major asset category, while also warning that inflation can erode their returns. More cash may also reduce the need to sell volatile investments after a market decline. The trade-off is that excess cash held for many years can produce a lower real return than a diversified growth portfolio.
When Less Cash May Be Considered
A household may review a large cash position when the balance is far above near-term spending needs, the account yield remains well below inflation, deposits exceed insurance limits without an ownership or bank-spreading plan, long-term retirement goals require growth, or several accounts duplicate the same liquidity purpose. A reduction in cash does not automatically imply adding gold. Stocks, bonds, Treasury Inflation-Protected Securities, I Bonds, real estate, and other assets may also be considered based on the household plan. Customers should speak to a financial or tax advisor before making decisions involving allocation, retirement income, or account changes. Goldco does not offer tax or legal advice.
Using Gold and Cash in a Diversified Retirement Plan
Gold vs cash retirement planning does not need to be an all-or-nothing choice. Cash can cover liquidity and near-term withdrawals. Gold may serve as an optional diversifier. Stocks can support long-term growth. Bonds can provide income and maturity planning. Inflation-linked securities can connect principal or interest more directly to inflation measures.
Investor.gov explains that diversification spreads money among asset categories but does not eliminate the possibility of loss. The allocation should reflect time horizon and risk tolerance. World Gold Council studies have tested gold allocations from 2% to 10% in hypothetical pension or institutional portfolios and reported improved historical risk-adjusted results in their selected periods. These are industry-sponsored, model-based results rather than a general rule. No single percentage suits every household.
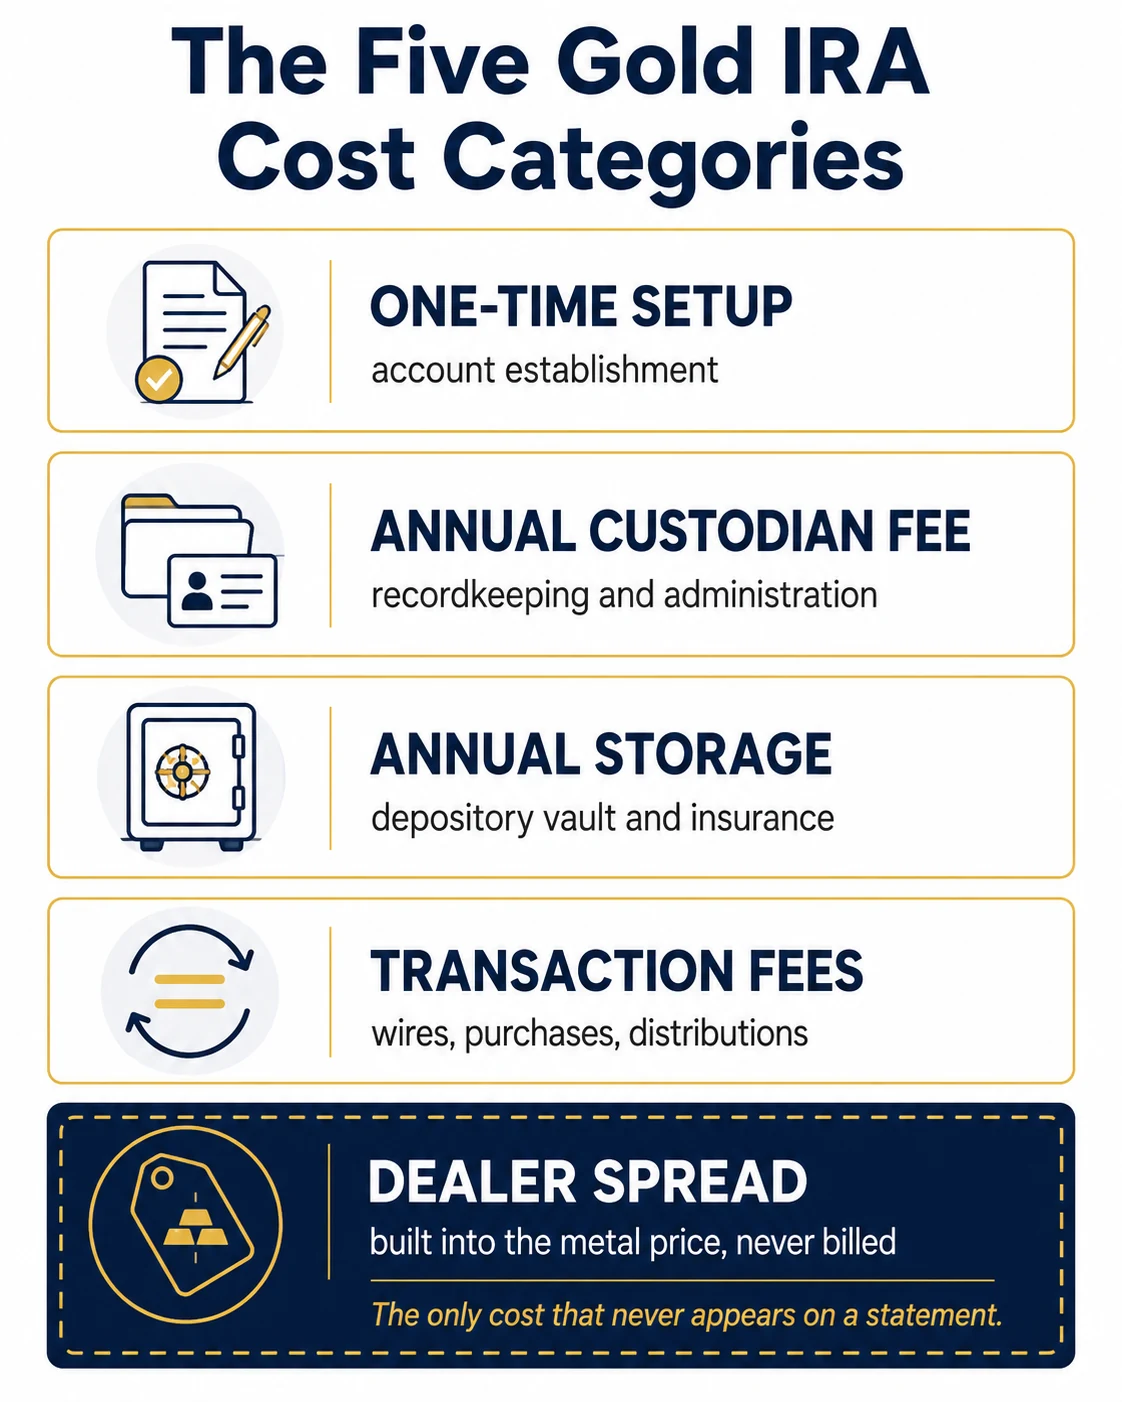
The how much gold should be owned in retirement guide examines allocation questions in more detail. The silver versus gold IRA cost comparison covers cost differences between the two metals. The Gold IRA versus gold ETF guide explains how physical IRA ownership differs from exchange-traded exposure. Physical gold held through a self-directed IRA can involve custodian, storage, transaction, and dealer charges, and retirement-account rules and tax consequences depend on the transaction. Customers should speak to a financial or tax advisor before making allocation, rollover, or withdrawal decisions. Goldco does not offer tax or legal advice.
How a Gold vs Cash Calculator Should Work
A useful gold vs cash calculator should compare both nominal and inflation-adjusted results. It should not assume that cash earns nothing or that gold rises every year. Core inputs can include a starting dollar amount, holding period, cash annual percentage yield, expected inflation rate, assumed gold annual return, gold purchase premium, annual storage or account cost, sale spread, and tax assumptions when applicable. Core outputs can show the ending cash balance before inflation, ending cash purchasing power in starting-year dollars, ending gold value before inflation, ending gold purchasing power after fees, total interest earned on cash, total gold ownership and transaction costs, the break-even gold return needed to match cash, and the difference between nominal and real results.
An Illustrative Comparison
The following example is not a forecast. Using a starting amount of $50,000 over 10 years, a cash APY of 3.5%, inflation of 3%, a gold return assumption of 4%, a gold purchase premium of 3%, an annual gold cost of 0.5%, and a gold sale spread of 2%: cash would end at about $70,530, with purchasing power of about $52,481 in starting-year dollars. Gold would end at about $66,916 after the stated costs, with purchasing power of about $49,792 in starting-year dollars.
Changing the gold-return assumption changes the result sharply. With a 0% annual gold return, the modeled real value would be about $33,638. With an 8% return, it would be about $72,621. Those figures demonstrate sensitivity, not expected performance. The Gold IRA calculator can organize retirement-account assumptions, the broader calculator library provides additional planning tools, and the Gold IRA quiz can help organize research questions before a company conversation.
Frequently Asked Questions
Does gold beat cash over time?
No universal answer applies. Gold has outperformed non-interest-bearing cash during some long periods and underperformed interest-bearing cash during others. The result depends on dates, cash yield, inflation, gold price changes, and ownership costs.
Does cash always lose value to inflation?
No. Non-interest-bearing cash loses purchasing power when prices rise. Interest-bearing cash can maintain or increase purchasing power when the after-tax yield exceeds inflation.
Is a savings account safer than gold?
An eligible savings deposit at an FDIC-insured bank has nominal principal protection within applicable insurance limits. Gold has no comparable federal price protection and can decline in market value. A savings account still carries inflation risk.
Does gold earn interest or dividends?
Physical gold pays no direct interest or dividend. Its financial return depends on the sale price after premiums, spreads, storage, insurance, and other costs.
Is gold liquid?
Gold is traded globally, but physical ownership requires a buyer, a quoted repurchase price, verification, and settlement. The sale amount can be below the quoted spot price because of dealer spreads and transaction costs.
What should a gold vs cash calculator include?
It should include cash yield, inflation, gold return assumptions, purchase premium, storage or account costs, sale spread, time horizon, and both nominal and real results. It should also make clear that the output is an illustration rather than a projection.
Conclusion
Gold and cash hold value in different ways. Cash provides immediate liquidity, nominal stability, possible interest, and federal deposit insurance for eligible bank deposits within applicable limits. Its main weakness is that inflation can reduce purchasing power when the after-tax yield falls short. Gold can appreciate and may diversify a retirement portfolio. It also has price volatility, no direct yield, and possible premiums, spreads, storage, insurance, and account costs. Its historical inflation relationship is mixed and depends on the period being measured. A balanced comparison uses the purpose of the money as the starting point. Customers should speak to a financial or tax advisor before making decisions involving retirement allocation, income, rollovers, withdrawals, or taxes. Goldco does not offer tax or legal advice.
Sources
- U.S. Bureau of Labor Statistics. CPI Inflation Calculator.
- U.S. Bureau of Labor Statistics. Purchasing Power and Constant Dollars.
- U.S. Bureau of Labor Statistics. Historical CPI-U (December 2025).
- Federal Reserve Bank of St. Louis. Federal Funds Effective Rate.
- FDIC. National Rates and Rate Caps, May 2026.
- FDIC. Understanding Deposit Insurance.
- FDIC. Deposit Accounts.
- Investor.gov. Money Market Funds.
- Investor.gov. Beginners' Guide to Asset Allocation, Diversification, and Rebalancing.
- FINRA. 10 Things to Ask Before Buying Physical Gold, Silver or Other Metals.
- World Gold Council. Gold Spot Prices and Market History.
- World Gold Council. Has Gold's Performance Structurally Changed?
- World Gold Council. Gold as a Strategic Inflation Hedge.
- World Gold Council. Investing in Gold.
- National Bureau of Economic Research. The Golden Dilemma.
- CFA Institute. Gold and Inflation: An Unstable Relationship.
- International Monetary Fund. The Gold Standard, Retrospect and Prospect.
- London Bullion Market Association. After the Gold Crash.
Article reviewed and edited by Daniel M. — editor, 401kToGoldIRA.org. Sourced to BLS, FDIC, Federal Reserve, Investor.gov, FINRA, and independent research; educational only, not tax or legal advice, and not a market forecast.