Gold IRA Break-Even Calculator: Estimate the Total Cost Hurdle
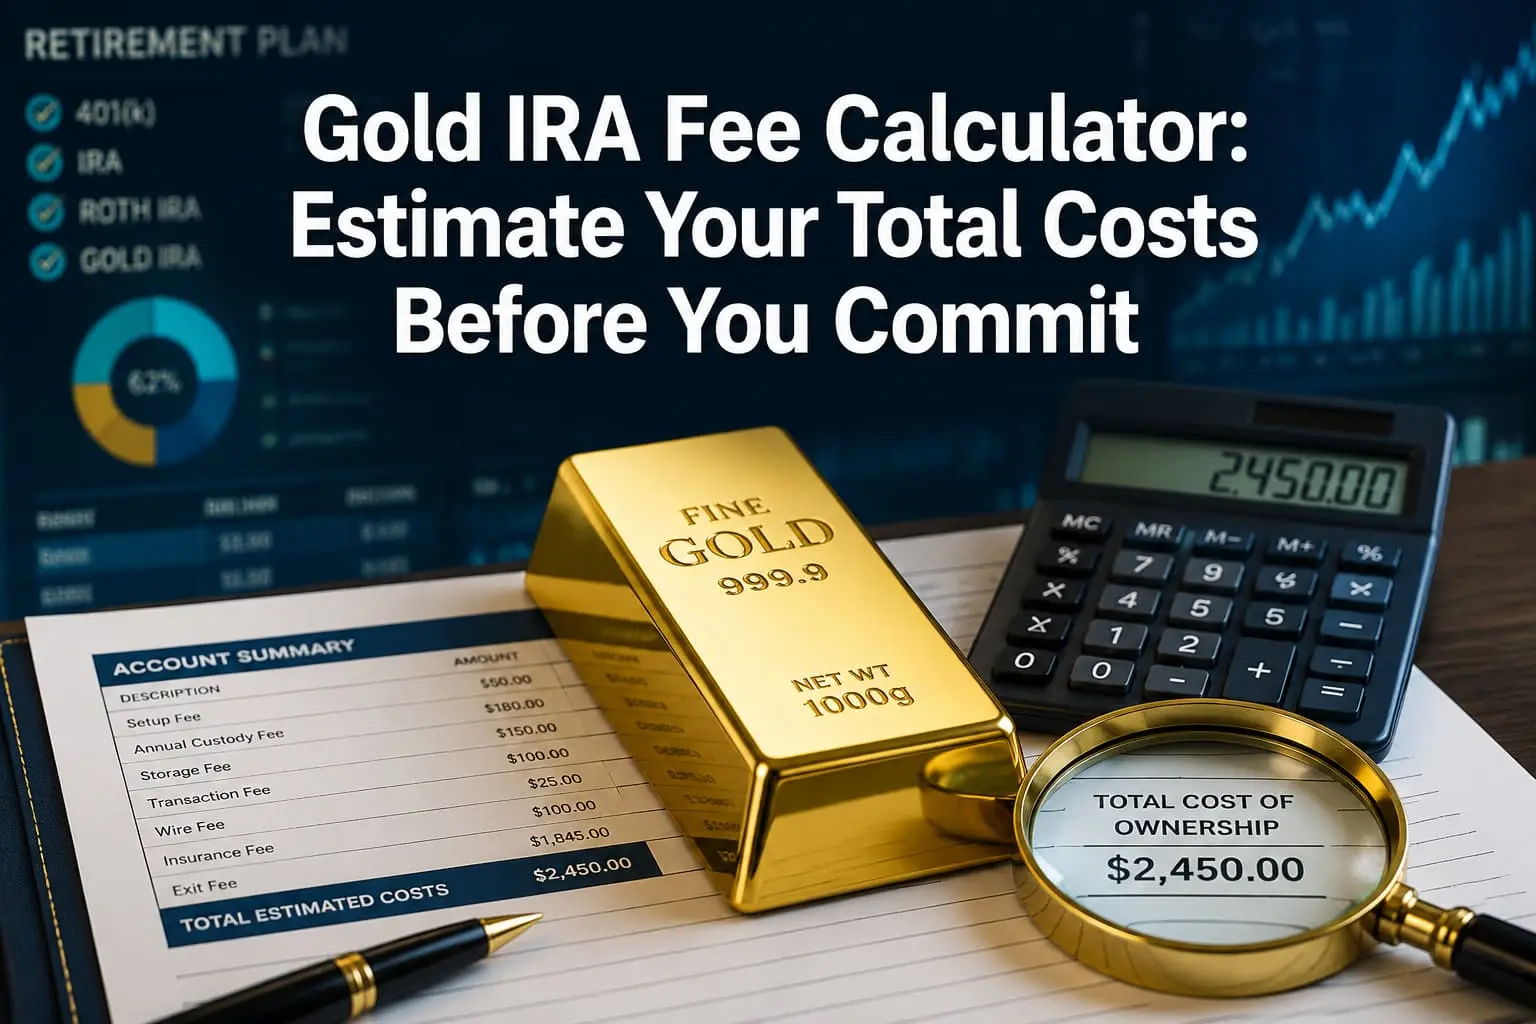
A Gold IRA break-even calculator combines the entire ownership cycle — dealer markup, setup fee, annual custodian and storage fees, transaction charges, and the estimated buyback spread — into a single figure: how much the metals must appreciate before the account recovers its costs. It is an educational tool for seeing the cost hurdle, not a forecast, quote, or recommendation of any provider.
Open the Calculator →Educational only: This tool produces illustrative estimates based on assumptions the user enters. It is not financial, tax, or legal advice, not a provider quote, and not a recommendation of any company or product. Fees, markups, and buyback spreads are set by independent dealers, custodians, and depositories and vary by provider. Customers should request written fee schedules and speak with a financial or tax advisor before making decisions. Goldco does not offer tax or legal advice. Past performance does not guarantee future results.
Quick Answer: How the Break-Even Calculator Works
A Gold IRA break-even calculator estimates how far the metals must rise in value before the account recovers everything it cost to buy, hold, and eventually sell the metal. The user enters an amount invested, a one-time dealer markup or purchase premium, a setup fee, recurring annual custodian and storage fees, a transaction charge, an estimated buyback spread, and a holding period. The tool adds the up-front costs, the accumulated annual costs across the holding period, and the exit costs, then expresses the total as the percentage the metals must appreciate to break even. Every input is chosen by the user, so the result reflects those assumptions rather than any specific provider's pricing.
Gold IRA Break-Even Estimator
Enter the amount invested, the cost assumptions, and a holding period. The tool shows total estimated costs and the appreciation the metals would need to break even. All figures are illustrative estimates based on the inputs only — not a forecast, quote, or recommendation.
The buyback spread is applied to the estimated future account value at sale; all other costs are applied to the amount invested. The estimate excludes metal price movement, income taxes, required distributions, and any fees not entered above. It assumes the metal balance is held steady and the annual fees stay level. Every input is chosen by the user, so no figure represents a specific provider's pricing or a forecast.
What Costs Go Into a Gold IRA Break-Even Point?
Break-even is the point at which the metals have appreciated enough to recover everything the account paid to own them. Several separate costs combine to set that hurdle, and each one raises the appreciation the metal must achieve before the account is even.
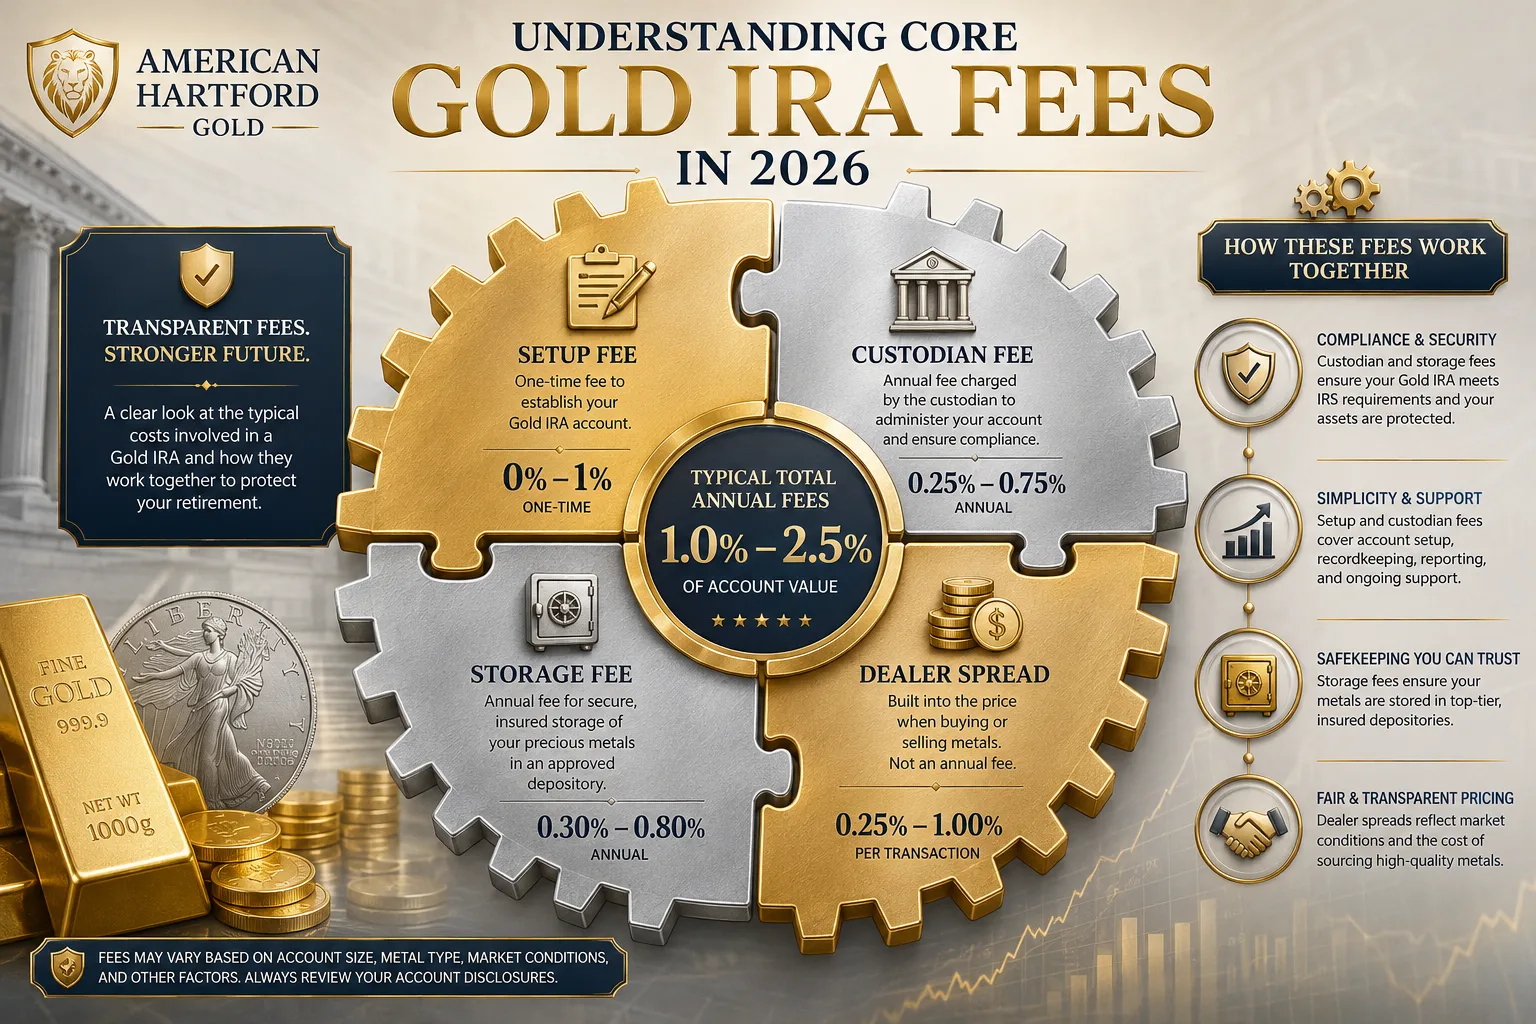
- Dealer markup or purchase premium: the amount a purchase price sits above the spot price of the metal. A dealer generally sells above spot, so a purchase can begin below break-even before any other fee.
- Setup fee: a one-time account-establishment charge from the custodian.
- Annual custodian fee: a recurring administration charge that accumulates every year the account is open.
- Annual storage fee: a recurring depository charge for holding the metal in an approved vault.
- Transaction and wire charges: per-transaction or settlement costs on purchases, sales, or transfers.
- Buyback spread: the gap between the price a dealer charges to sell metal and the lower price it pays to buy it back. This exit cost is realized only when the metal is sold.
The FINRA and CFTC advisory on buying physical gold or other metals explains that dealers normally sell above the spot price and buy back below spot, that the difference is the spread, and that each dealer sets its own. It advises customers to request all fees, retail prices, and buyback terms in writing (FINRA and Commodity Futures Trading Commission). Because these costs come from different parties — the dealer, the custodian, and the depository — comparing written figures across providers is the most direct way to lower the break-even hurdle.
Why Does a Gold IRA Start Below Break-Even?
A new precious-metals position usually begins below break-even because of the buy-sell spread alone. If a dealer sells metal at a markup over spot and would buy it back below spot, the account is already behind on the day of purchase before any annual fee is charged. Adding a setup fee and recurring custodian and storage fees pushes the hurdle higher, and the longer the metal is held, the more the accumulated annual fees add to the total.
This is why break-even is best understood across the full holding period rather than in a single year. A recurring annual cost that looks small in year one compounds into a meaningful cumulative total over ten or twenty years. The Gold IRA fee calculator estimates the ongoing cost side, and the Gold IRA buyback calculator estimates the exit value; this break-even tool combines both sides plus the up-front markup into one appreciation threshold.
Compare the full toolkit
This is one of several educational calculators covering fees, storage, RMDs, allocation, and more.
See All Calculators →How to Use the Break-Even Estimate
- Enter real written figures. Use the dealer markup, buyback spread, setup, custodian, and storage fees a provider has put in writing rather than estimates, so the break-even reflects an actual offer.
- Model the full holding period. Break-even rises with time because annual fees accumulate, so set the number of years to match the intended hold.
- Compare providers. Run the same amount invested and holding period against two providers' written costs to see which produces a lower break-even hurdle.
- Weigh it against the metal's role. A higher break-even is not automatically disqualifying, but it should be understood before funds move. Gold produces no interest or dividend, so the appreciation must do all the work.
- Separate cost from performance. The tool estimates the cost hurdle, not whether the metal will clear it. The gold-versus-cash guide explains why total ownership cost matters when comparing gold with an interest-bearing alternative.
Customers should request written fee schedules and precious-metals quotes and speak with a financial or tax advisor before making decisions about retirement accounts, rollovers, or allocation. Goldco does not offer tax or legal advice.
Frequently Asked Questions
What does a Gold IRA break-even calculator do?
It estimates how much the metals must appreciate before an account recovers its total ownership costs — dealer markup or purchase premium, setup fee, annual custodian and storage fees, transaction charges, and the estimated buyback spread — over a chosen holding period. It is an educational estimate based on the user's assumptions, not a provider quote.
Why does a Gold IRA start below break-even?
Dealers generally sell metal above the spot price and buy it back below spot, so a purchase can begin below break-even even before any fees. The FINRA and CFTC advisory calls this difference the spread, and each dealer sets its own.
Do annual fees change the break-even point?
Yes. Annual custodian and storage fees accumulate over the holding period, so the longer the metal is held, the more the account must appreciate to cover them. Flat annual fees are a larger percentage burden on a smaller account.
Is the break-even estimate a forecast of gold prices?
No. The calculator estimates the appreciation needed to recover costs; it does not predict whether or when gold will reach that level. Past performance does not guarantee future results.
How can an investor lower the break-even hurdle?
Requesting written dealer markups, buyback spreads, and fee schedules, and comparing providers, can reduce total ownership costs. Lower costs mean the metal needs to appreciate less to reach break-even.
Methodology and Limitations
Methodology. Up-front costs are the dealer markup (a percentage of the amount invested) plus the flat setup fee. Annual costs are the custodian fee plus the storage fee, multiplied by the holding period in years. Exit costs are the transaction charge plus the buyback spread applied to the estimated account value at sale (approximated as the amount invested grown by the break-even amount, solved so total costs are recovered). The break-even appreciation is the total estimated cost expressed as a percentage of the amount invested. The result is shown as a total dollar cost, a percentage of the amount invested, and the appreciation the metals must achieve to recover those costs.
Assumptions and limitations. The metal balance is assumed steady and the annual fees level across the holding period unless changed by the user. Metal price movement, income taxes, required minimum distributions, insurance billed separately, and any fee not entered above are excluded. All inputs are chosen by the user, so no figure represents a specific provider's pricing or a forecast. This tool is educational only, is not a provider quote or a suitability assessment, and should support discussion with a qualified professional rather than serve as the basis for a decision. Customers should request written fee schedules and speak with a financial or tax advisor. Past performance does not guarantee future results.
Tool reviewed and edited by Daniel M. — editor, 401kToGoldIRA.org. Educational only; not tax or legal advice, and not a provider quote. Cost concepts sourced to the FINRA/CFTC precious-metals advisory.